Outlier
Contents
Outlier#
Outliers are the extreme values that exhibit significant deviation from the other observations in our data set. By looking at the outlier, it initially seems that this data probably does not belong with the rest of the data set as they look different from the rest.
An outlier may occur due to the variability in the data, or due to experimental error/human error. They may indicate an experimental error or heavy skewness in the data(heavy-tailed distribution).
In the cases when you have a small sample size, outliers can significantly mess up all your results. For statistical analysis of data, outliers can impact the normality test results of our data, invalidate the basic assumptions like constant variances for regression testing etc.
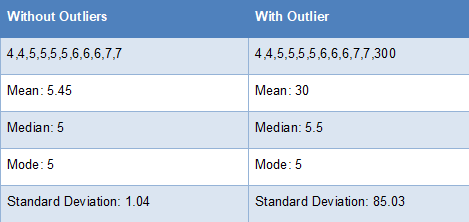
Outliers tend to affect mean more than mdeian or mode#
Detecting Outliers#
When starting an outlier detection quest you need to answer 2 important questions about your dataset:
Which and how many features am I taking into account to detect outliers ? (univariate / multivariate)
Can I assume a distribution(s) of values for my selected features? (parametric / non-parametric)
Here are some of the techniques for detecting outliers:
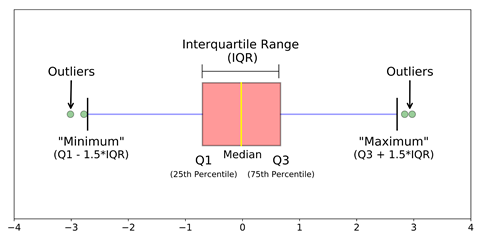
IQR and Boxplots: Usually data points which lie 1.5 times of IQR above Q3 and below Q1 are considered outliers
Z-Score or Extreme Value Analysis (parametric): The z-score or standard score of an observation is a metric that indicates how many standard deviations a data point is from the sample’s mean, assuming a gaussian distribution. This makes z-score a parametric method. Very frequently data points are not to described by a gaussian distribution, this problem can be solved by applying transformations to data ie: scaling it. It is a very effective method if you can describe the values in the feature space with a gaussian distribution. However, it is only convenient to use in a low dimensional feature space, in a small to medium sized dataset.
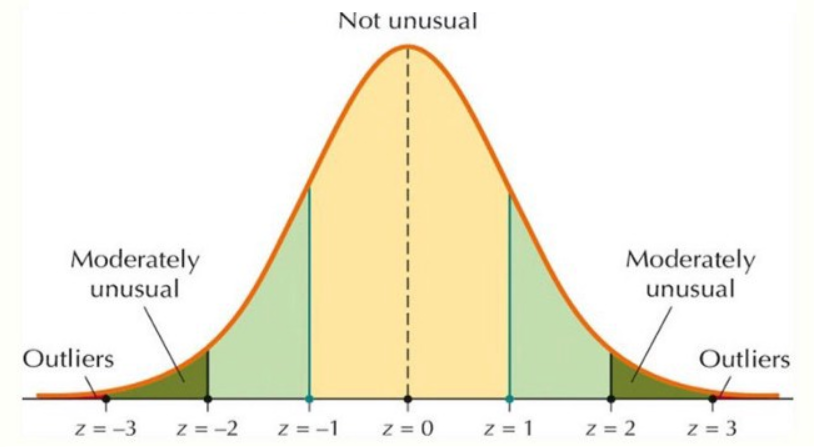
Any data point whose Z-score falls out of 3rd standard deviation is usually considered an outlier#
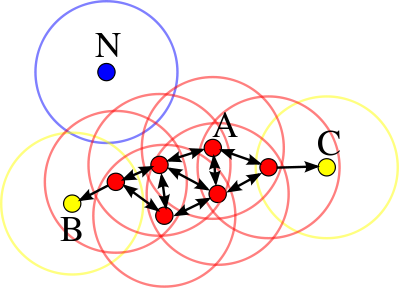
Dbscan: Dbscan is a density based clustering algorithm, it is focused on finding neighbors by density (MinPts) on an ‘n-dimensional sphere’ with radius \(\epsilon\). A cluster can be defined as the maximal set of ‘density connected points’ in the feature space.Dbscan then defines different classes of points:
Core point: A is a core point if its neighborhood (defined by \(\epsilon\)) contains at least the same number or more points than the parameter MinPts.
Border point: C is a border point that lies in a cluster and its neighborhood does not contain more points than MinPts, but it is still ‘density reachable’ by other points in the cluster.
Outlier: N is an outlier point that lies in no cluster and it is not ‘density reachable’ nor ‘density connected’ to any other point. Thus this point will have “his own cluster”.
It is an unsupervised model and needs to be re-calibrated each time a new batch of data is analyzed.
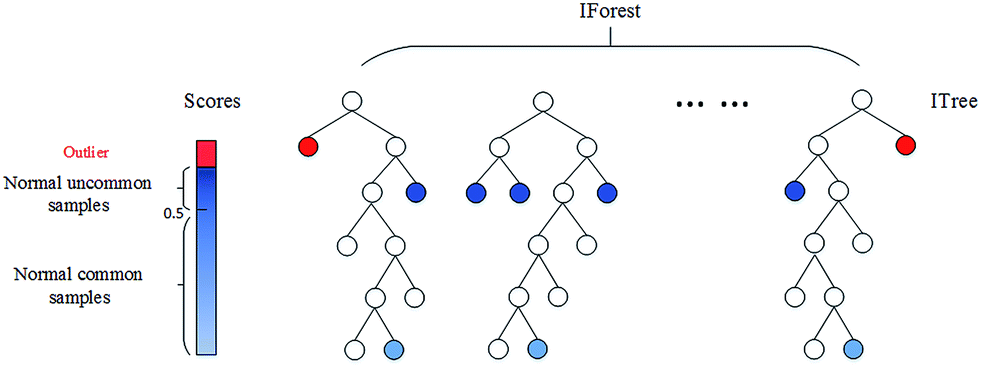
Isolation Forests: Isolation forests are an effective method for detecting outliers or novelties in data. The basic principle is that outliers are few and far from the rest of the observations. To build a tree (training), the algorithm randomly picks a feature from the feature space and a random split value ranging between the maximums and minimums. This is made for all the observations in the training set. To build the forest a tree ensemble is made averaging all the trees in the forest.
Then for prediction, it compares an observation against that splitting value in a “node”, that node will have two node children on which another random comparisons will be made. The number of “splittings” made by the algorithm for an instance is named: “path length”. As expected, outliers will have shorter path lengths than the rest of the observations.
If not correctly optimized, training time can be very long and computationally expensive.
Dealing with Outliers#
Below are a few common practices to deal with Outliers:
Drop the outlier records
Cap your outliers data or even you can try binning them
Assign a new value: If an outlier seems to be due to a mistake in the data, you try imputing a value. Common imputation methods include using the mean of a variable or utilizing a regression model to predict the missing value
Try a transformation: A different approach to true outliers could be to try creating a transformation of the data rather than using the data itself. For example, try creating a percentile version of your original field and working with that new field instead.